New tech approaches to understanding hive health - Video and Data Analytics

Beekeeping & Apiculture Forum

Help Support Beekeeping & Apiculture Forum:

This site may earn a commission from merchant affiliate links, including eBay, Amazon, and others.
What exactly are you measuring? The number of bees entering & leaving the hive? How do you measure colony health in winter when the bees are probably at their most vulnerable, and when they're not flying?

).

To measure colony heath with this system? You cannot see it in front of entrance. It is sure.

Guys speak often about their healthy hives, but they are not able to identify diseases and pests of hives. Just talking.
.
 
This is very interesting to me as I've currently plugged a few sensors into my hive. Are you developing your own model to analysis the data or did you start with some published research?

What I've found is that location even a few miles apart has an impact on the hive performance, I'm toying with seeing if I can pull down some local weather data to use as some form of weighting.

Mine is just playing, not an ongoing endeavour like you appear to be doing.

Good luck.

Hi Domino, thank you for your interest, I'm glad you find the project interesting!!

Completely agree on microclimate being a big factor in bee activity, even just whether and when a hive gets sun throughout the day seems to have a big impact on activity. we found so far that wind is a pretty reasonable data point to pull from local weather stations, but temperature and humidity are going to have a significant error from the reality at the actual hive.

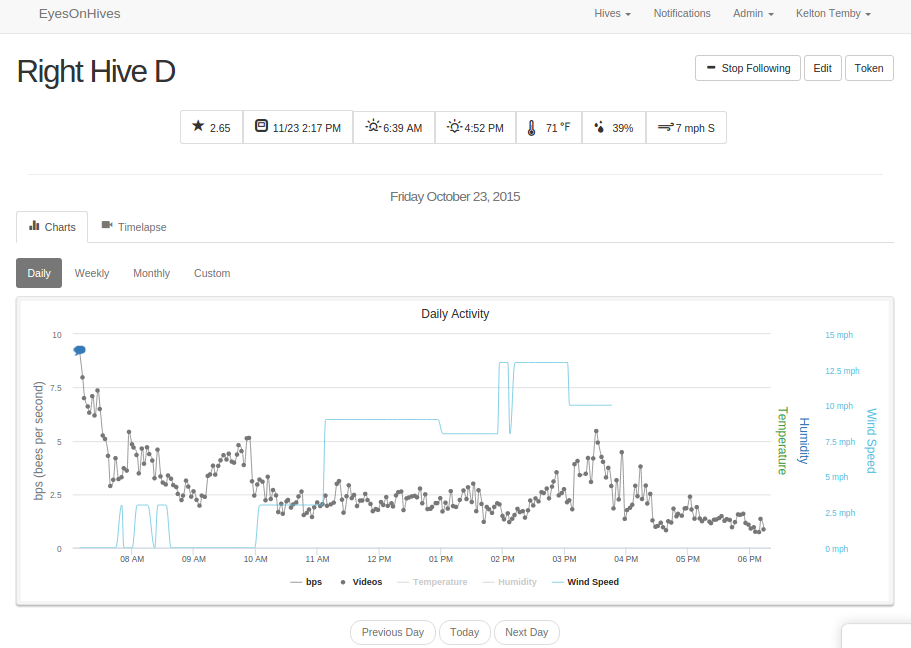
I like this picture which shows how wind modulates orientation activity (and caused it to not occur at any significant level).
FtyquP1.png


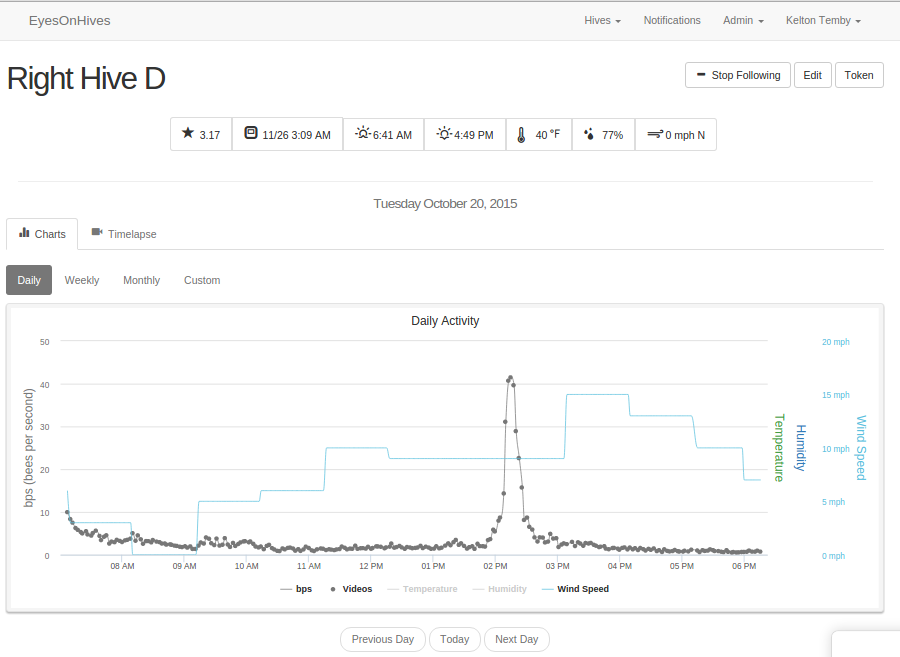
Compare that to a regular day with a little less wind
10SRmNv.png


We are developing all of our own analytics, partly because we're looking at hive activity differently to any of the invasive 'counter in entrance' approaches. By looking at the general activity of how many bees are flying at any one moment, we actually pick up behaviors like the hovering back and forth we see with orientation flights/spikes. Since we're the first to measure this way, we had to develop tools to identify this and other patterns.

The approach taken in the only other non-invasive approach we saw, the Intel paper, was interesting, but their approach had no way of scaling to run on a low power device, or pick up the activity of >50 bees at a time that's seen in robbing/orientation. It's fine and fun for the rest of the day, but we think the big changes in activity are pretty interesting!

We're talking with the good people at University of California Davis about further studies using the tools we're developing, to introduce what we're doing to academia. We are keen to see what citizen scientists and researchers will come up with too. Part of the platform is the ability to tag and flag different activities, so everyone can get involved in the research. It's also really fun to tackle these problems - we spend a lot of time in Matlab developing, testing and tweaking new algorithms! Also probably more, less-fun time porting them over to the server code and devices!
 
What exactly are you measuring? The number of bees entering & leaving the hive? How do you measure colony health in winter when the bees are probably at their most vulnerable, and when they're not flying?

Like Domino, I have some sensors measuring temperature & humidity but it's just for fun. I also have a bunch of other sensors I plan on building into the kit over winter so I should have more next year. Unfortunately they're not as well located as they could be, so they're not giving accurate brood temperatures: http://beespi.mybluemix.net/, although my camera merely watches them - no sophisticated algorithms (yet).

Thanks for your thoughts Brendan, that's a cool page! We started out with the streaming video at first too, it's pretty awesomely satisfying to be able to see your bees remotely :) Now imagine if you could get the 'highlight reel', and be able to see the most interesting things that happened throughout the day!

We're measuring the number of flying bees in front of the hive, and using analytics to classify activity behavior patterns. We're cross correlating data between hives, and also using environmental data to understand causes of changes in activity.

This device is non-invasive, so isn't measuring anything inside the hive. We heard a lot of the same story you describe for internal sensors giving changes in temperature that are more to do with the cluster moving around, especially in winter, than with any particular 'issue'. One thing we have been playing with is long wave IR, which lets you see where the colony is, and get a sense of its temperature, but the sensors are just way too expensive for the average beekeeper's toolkit.

Over in the US in 2014, summer losses exceeded winter losses. Agree that traditionally winter losses have been a big issue, my understanding is there are many known factors, but colony strength leading up to the winter (and beekeepers taking out too much honey) plays a significant role, keen to hear feedback on this though. I'm curious whether beekeepers in cold climates have interventions available to help wintering colonies too.

Would you find it useful to know how your hive's activity data looks at the onset of winter relative to other hives in your climate zone?
 
Thanks for sharing your thoughts Finman. We hope researchers will find it useful too. We also hope everyday beekeepers will enjoy being able to see their bees remotely, and know how their bees are doing.

I highly recommend checking out "At the Hive Entrance" by Storch. The theme is "How to know what happens inside the hive by observation on the outside". It's one of the inspirations behind our system.

[ame="http://www.amazon.com/At-Hive-Entrance-H-Storch/dp/1502864703"]At the Hive Entrance: H Storch: 9781502864703: Amazon.com: Books[/ame]. You can also find it online free on some websites with a google search.
 
2 weeks of stored data

Hello KTemby, I like the expedient of keeping a back-log of data/video stored locally, so that it can be collected at an apiary visit to supplement sketchy or non-extant wifi internet links.
The practice has been used on trans-global High Altitude Balloon flight, where data that was being transmitted regularly was also stored and compressed so that after an ocean transit the first receiving stations had not only the current telemetry state, but a number of days of compressed digest. This was sorted out on presentation to the database to fill in the blanks.
I suspect as the cost of embedded devices continues to fall and the Maker communities grow, then there will be a lot of experimentation done which in good time will establish a few reliable methods, probably yet to be identified.
Over the last couple of years the possibilities of instrumenting hives, from a point of technical interest, has been becoming ever easier.
I wish you well with your research and venture. Whilst you may be essentially commercial, you are sharing your technical thoughts with the forum members; which I think is laudable.
 
I wish you well with your research and venture. Whilst you may be essentially commercial, you are sharing your technical thoughts with the forum members; which I think is laudable.

Hi Hombre,

Thank you for your note and encouragement, the team and I really appreciate it! That's pretty awesome High Altitude Balloon flight folks solved similar problems too.

Happy to let you know our goal of putting another 30 systems out into the field was successfully funded, and we're now live with pre-orders. My goal for the business is to keep the very smart people we have working on this, able to keep working on this. Fortunately we're starting to see more interest from more beekeepers!

We have been very busy developing methods to handle the 'off grid' use case, and I'm happy to share we have a solar configuration, and are managing data both on the device as well as in the cloud. If there's enough interest, we'll make a smart local data storage version available. Right now the initial application for that has been some of our early customers who wish to measure their hive activity for the California almond pollination.

I'll share more details in another post, but it was truly amazing to see our Local Beta hives all hit minimum hive activity in the same week (last week of November 2015), across a 30km distance from each other. The rate that some hives built back up was one of the key differentiators we observed in what our local community sees are 'weak' vs 'strong' hives. While it seems obvious when you think about it, we could explain better build up into our spring (winter is very mild locally), by which hives had little wind and more hours of early morning sun.
 
Last edited:
Back
Top